send link to app
ARL simulation of T2 control chart app for iPhone and iPad
4.4 (
8544 ratings )
Productivity
Developer: Francisco Aparisi
Free
Current version: 1.1, last update: 8 years agoFirst release : 04 Mar 2016
App size: 40.39 Mb
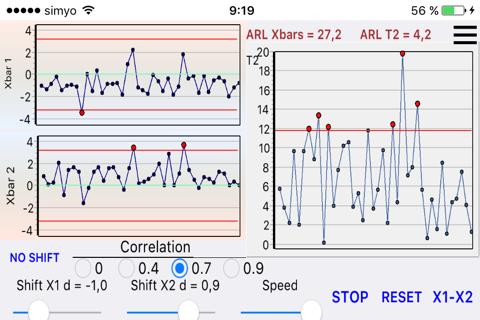
This application makes a comparison between the use of two Xbar control charts and one multivariate T2 control chart.
The user can change the correlation between the two variables and the shift of each variable.
The software computes the ARL by simulation and it is possible to see in which cases the multivariate scheme is really more efficient that employing two Xbar control charts.
The control limits of the two Xbar chart are placed in order to have always an in-control ARL = 370. The T2 has the same in-control ARL as well. Sample size is n = 1.
Supported languages are Spanish and English.
This app is available for MAC (OS X) too.


